7 min read
We’ve been providing market trend reports for some time now, and one of the most common pieces of feedback we’ve received from you, our audience, is for more information on the different components of our investing framework — the architecture that guides our investing decision-making. Specifically, valuations, the process of quantifying the “fair value” of an investment, asset, or firm.
Long-term valuations count on mean reversion to work, which is very challenging to do behaviorally. Mean reversion refers to the financial theory that posits asset prices tend to return back to a normal or average state following an extreme price move.
🔎 Related: What is our investing framework for decision-making?
So, today, we are going to dig into valuations from a macro perspective, as it relates to our framework. Then, we’ll cover how it flows into our strategic asset allocation, capital market assumptions, and then (ultimately) how the tactical pieces of our recommendations flow with valuations.
Now, remember, 12 years is the average time it takes for mean reversion. That’s a long time for clients to wait. But what does this look like practically?
It’s Called the “Cocktail Party Phenomenon”
Imagine it’s 1996, and you’re going to cocktail parties. You’re rubbing shoulders with folks who are making money hand over first, and the markets are wildly overvalued. It may be tempting to dive into the fray, to join your friends who are confident in their investing choices, and are (seemingly) reaping the benefits of those decisions.
If you’re just following valuations, however, you should probably have a more conservative stance. Why? Because we erased all the gains gained in the market from 1996 through its peak in 2000, but it took a long time for the mean reversion to happen.
🔎 Related: Should I be scared to look at my investment accounts?
Again, this is a very difficult thing to do from a human behavior standpoint — you have to work against ingrained instincts such as herd mentality, overconfidence bias, hindsight bias, etc. These factors make it challenging to follow valuations. We all aspire to be Warren Buffett because this is our Warren Buffett influenced approach to markets, but we really don't have the intestinal fortitude to do it.
When you’re a financial or investment advisor, running your business based on valuations is exceptionally challenging. Just look at Jeremy Grantham’s story. In 2000, he said the market would have a negative rate of return over the next 10 years. He lost 60% of his clients, and he was an institutional consultant, so his clients were huge endowments. Was Jeremy eventually proven correct, and did his clients all come back? Yes, but that is a long time to wait.
OK, let’s go back to our framework for a moment.
Risk Sentiment Is Now Positive
We talked about this last month. We were right on the cusp market internals, the percentage of stocks on buy signals, and so on. Several sectors and factors relative to the broad market were diverging negatively versus price.
But we had a shift this month. Three of the six we were following moved our market internals measure back positive. Price trends and market internals are now both positive. That’s the way the trend system works — if we’re in an absolute positive trend in high yield bonds, international and domestic stocks the indicator can flash neutral at worst. It takes both price trends and market internals to confirm a positive reading.
🔎 Related: How much does investment management cost? (+ examples)
Leading Indicators Have Also Improved
Another change we saw is that leading indicators actually improved for the first month in 23 months. That said, we do need to take a look at those leading indicators in context. This happened at the same time we've got real retail sales and industrial production now negative on a year-over-year basis, while non-farm payrolls are still positive.
But if you look at the household survey from January, the data still showed a lot of jobs lost. More specifically, 1.87 million full-time jobs were removed out of the market over the last quarter. So, when you look at that employment level, we see it is really deteriorating fast. So you have three out of the big four deteriorating.
🔎 Related: What happens to the stock market during a recession? (+ examples)
The thing that's keeping the coincident indicators in positive territory has been personal incomes and spending. Retail sales, industrial production, personal incomes and spending, and employment are all indicators the NBER (National Bureau of Economic Research) looks at to determine a recession.
Does the Declaration of a Recession Matter?
Absolutely not, because by the time it's announced it is usually over — a recession is just narrative. Chris has talked about this in depth before, and he put it best when he said:
When we talk about recessions, we are never doing so in the present tense. That’s why we’re more concerned with what’s happening right now in the economy in order to make the smartest investment decisions possible.
“Yes, it is an informative and educational exercise to look to recessions of the past to understand what may happen in the future. But in terms of how we make smart decisions in the present, we watch monthly leading economic indicators — unemployment numbers, volume of layoffs, types of layoffs, stock market valuations, and so on — that we can look at in real-time.” (Read the full article.)
What matters to us are what leading indicators are doing, and they are starting to improve. The three-month isn't positive yet, nor is the six-month, but we expect that over the next quarter. So, we could easily see our business cycle indicator move to neutral or positive this quarter — we think the acceleration in growth will happen in conjunction with rising inflation.
🔎 Related: What are the top 4 risks of investing? (+ examples)
You don't have to look past cocoa prices or other commodities that have been accelerating. That's what inflation is doing. It's moving upward. So, we think growth and inflation are going to accelerate.
Let’s Look at Expected Returns
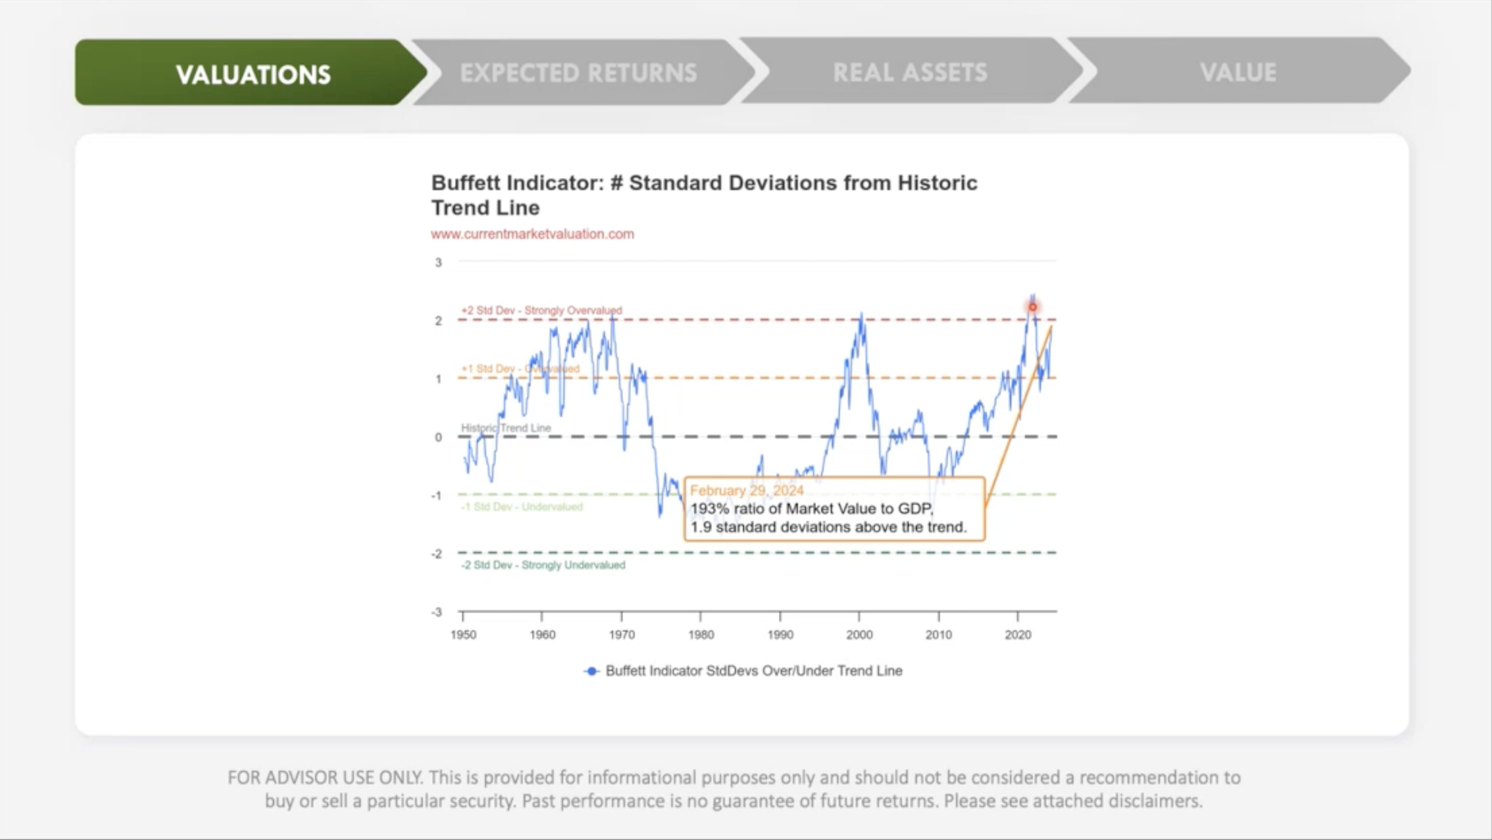
When we look at expected returns, we don’t see any changes. It’s still negative for the U.S., for the S&P 500, and I want to reiterate U.S. Treasuries are priced to outperform the S&P 500. Now, let’s dig into the Buffet Indicator:
The Buffet Indicator compares the total U.S. stock market to the total U.S. economy by dividing the U.S. stock market value by U.S. GDP.
If you look historically, if you look at this chart, overvalued tends to revert back to lower value. Lower value tends to revert back to overvalued. That's what you want to see in a valuation statistic. You want to see when it's high that returns end up being low over the next 10 years. Again, 12 years is the average for mean reversion. So, over the next 10 to 20 years, you want to see low returns, and vice versa.
🔎 Related: Asset management vs. wealth management, which is right for you?
Where are we today? We’ve reached one of the highest levels that this indicator has ever triggered going back as far as we have data. In fact, the indicator suggests markets are trading almost two-standard deviations above fair value. That, according to Jeremy Grantham, is how you define a bubble.
Remember, bubbles aren’t necessarily bad. And just because valuations are high doesn’t mean you have to be bearish. We have got to get away from this notion of bullish versus bearish. This is not a binary world, this is not the way to think of things. Sure, opportunities for growth may not be in the S&P 500, but where else should we be looking? What other opportunities exist out there?
What About Equity Risk?
The equity risk premium is the difference between what stocks should earn over the next 10 years, and what treasuries are priced to earn over the next 10 years. With the 10-Year Treasury yielding over 4%, we are at -3.5% risk premium for the S&P 500.
That doesn't make any sense. Yes, this has happened before, but I think only five times historically. What this suggests is that you are paying a premium above the risk-free rate to move out and take risk.
🔎 Related: 7 best compound interest investments (overview + examples)
I actually saw an article in the Wall Street Journal suggesting that stocks are essentially “risk-free” and I almost fell out of my chair when I was reading it. I thought it was an April Fool's Day joke. For a moment, I felt like Ron Burgundy in Anchorman, “I wrote it down in my diary that the Wall Street Journal said something very funny.”
Well, it’s not a joke, and risk premiums are telling us this is what market participants have started to believe, classic “new era thinking.” In my opinion, valuations tell us more about long-term sentiment than any other measure. And right now, they are telling you that equity markets are risk free. That is an absurd notion.
What Are Our Biggest Opportunities?
Real assets, in particular commodities
We are running out of key commodities. Governments are spending a ton of money. We have scarce resources from a commodity perspective. We have underinvested in commodity infrastructure and mining. So, supply is constrained, demand is growing.
🔎 Related: Real assets vs. financial assets (overview + examples)
What happens when supply is constrained and demand is growing, all else being equal? Typically you get price increases. Commodities versus S&P 500 is near an all time low. I'm not saying go rushing to buy and hold now, but you know what we are doing and what we've been recommending for years, add trend-following strategies to your portfolio.
It has never been easier to incorporate these strategies in your portfolio. There are ETFs, mutuals funds, and my personal favorite, private partnerships available.
Global real estate
And again, I prefer private over public here. I don’t recommend rushing in to buy REITs. My opinion, I think it's a better client experience to go private. But with global manufacturing renaissance here in the states with valuations this depressed, there are some significant opportunities to take advantage of if you're prudent. So, get some real assets in your life.
Value, i.e., Promises Over Profits
This is one I'm so excited about. The chart is comparing non dividend paying stocks versus dividend stocks. What in the world are we doing? The market is paying a premium for companies that don’t pay dividends, that don't reward the shareholders with cash flows.
To borrow the Robert Kioysaki definition of an asset, an asset produces cashflow. The market is rewarding promises over profits currently. This will most likely reverse. We're at a valuation level that we haven't seen in a long time other than 2021, and I think this reversion could be just getting started.
🔎 Related: How to choose a financial advisor (tips + questions to ask)
It's very easy. Go to high dividend payers, go to dividend growers. These are companies that have been beaten up by the S&P 500 over the last two years, but they're high-quality companies that tend to be undervalued relative to the market.
Private Over Public
There is a ton of opportunity within private investments. Whether it is in systematic diversified trend-following, infrastructure, venture capital, and real estate. You have an amazing chance to find great operators and negotiate good terms because of underinvestment. You're not chasing the typical private credit manager or private equity manager. You're going after areas that have been unloved and undervalued.
